

Why Automate Company Financial Analysis?
Financial analysis requires gathering data from multiple sources — SEC filings, financial statements, analyst estimates, and market data — then computing ratios, identifying trends, and presenting findings in a format that stakeholders can quickly understand. For investment analysts, consultants, and finance teams, this process consumes hours per company. When you need to analyze multiple companies for a portfolio review, due diligence exercise, or competitive analysis, the time requirement becomes prohibitive.
Automating the data collection and initial analysis stages with Autonoly lets financial professionals focus on interpretation and judgment — the high-value parts of analysis — rather than data entry and spreadsheet formatting. The PDF output creates a professional deliverable ready for client meetings, investment committee presentations, or due diligence documentation.
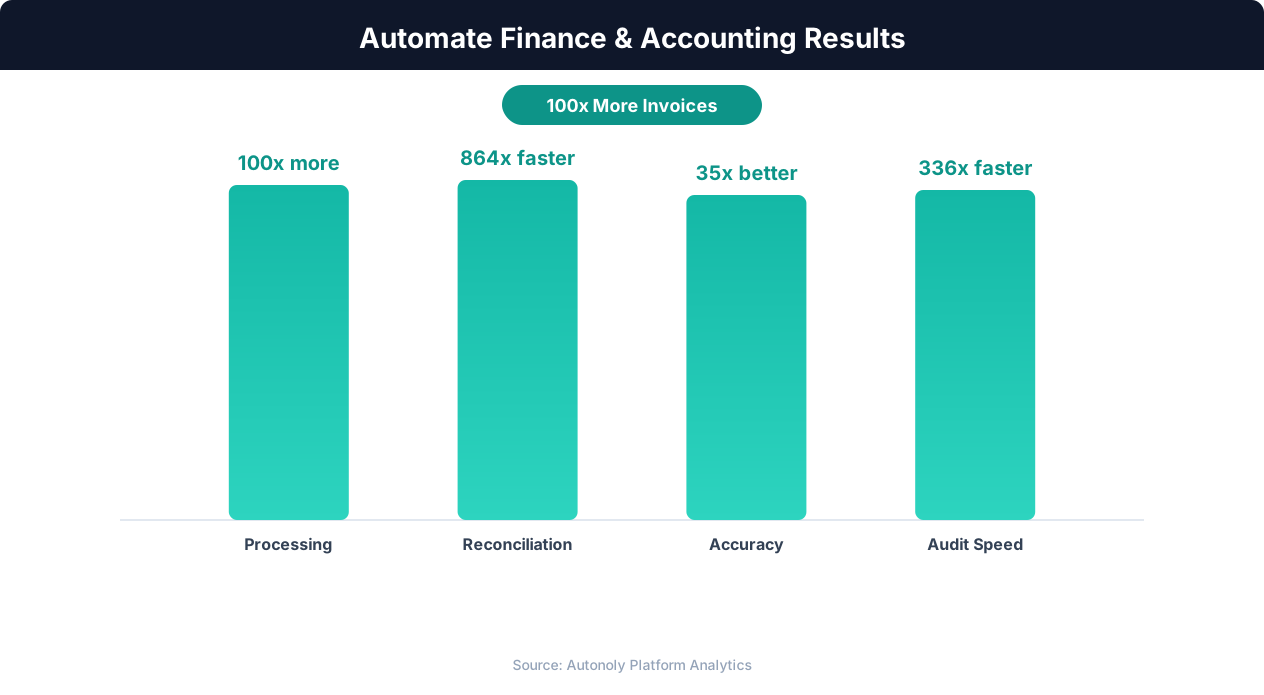
Time savings from automating financial reporting workflows
Key Insight: Manual invoice processing costs $15-$40 per invoice. Automation reduces this to $1-$3, a savings of up to 92% per transaction (Ardent Partners).
How Autonoly Builds Financial Analysis Reports
The AI Agent Chat lets you request analysis naturally. You might say "analyze Apple, Microsoft, and Google — compare revenue growth, margins, and free cash flow over the last 5 years. Generate a PDF report." The agent handles everything from data collection to report delivery.
Multi-Source Financial Data Collection
Using Browser Automation, the agent navigates financial data sources — the SEC's EDGAR system for official filings, Macrotrends for historical data, Yahoo Finance for market data, and company investor relations pages. The full Playwright browser handles the complex interfaces of financial databases, including XBRL viewers, interactive financial statements, and paginated filing archives.
The Data Extraction engine pulls structured data from financial statements — revenue, COGS, gross profit, operating income, net income, total assets, total liabilities, shareholders' equity, operating cash flow, capital expenditures, and free cash flow. Multiple years of data are captured for trend analysis.
Python-Powered Financial Computation
The extracted data flows into Python analysis via the SSH & Terminal feature. The agent computes profitability ratios (gross margin, operating margin, net margin, ROE, ROA), liquidity ratios (current ratio, quick ratio), leverage ratios (debt-to-equity, interest coverage), efficiency metrics (asset turnover, inventory days), valuation multiples (P/E, EV/EBITDA, P/S, P/B), and growth metrics (revenue CAGR, earnings growth, margin expansion/compression).
For multi-company analysis, the Data Processing feature builds peer comparison tables showing how each company ranks on every metric. Trend analysis reveals whether each company is improving or deteriorating on key dimensions.
Professional PDF Reports
The report is designed for executive and stakeholder consumption. Each company section includes an overview with key metrics, a 5-year financial summary with trend charts, profitability analysis with margin trends, balance sheet analysis with leverage assessment, cash flow analysis with free cash flow trajectory, and a peer comparison positioning the company relative to competitors.
Charts are generated with matplotlib and seaborn — revenue and earnings bar charts, margin trend lines, ratio comparison radar charts, and cash flow waterfall diagrams. The visual quality matches what you would expect from a professional research report.
Peer Comparison
The most powerful feature is automated peer comparison. Provide a list of competing companies, and the workflow extracts financial data for all of them. The PDF report includes side-by-side ratio comparisons, highlighting where the target company outperforms or underperforms its peers. This contextualizes raw numbers — a 20% net margin means different things in software versus retail. The peer comparison tables rank each company on every metric, making relative strengths and weaknesses immediately visible.
Customization for Different Use Cases
The Visual Workflow Builder lets you configure the analysis for your specific use case. Investment due diligence reports emphasize valuation and growth. Credit analysis reports focus on leverage and coverage ratios. Competitive intelligence reports highlight relative positioning. The Logic & Flow feature adds conditional sections — including a special warning section when leverage ratios exceed safe thresholds or when margins are declining for consecutive quarters.
Scheduling and Distribution
Quarterly analysis timed around earnings season keeps reports current. Investment analysts run company financials reports after each earnings release. Private equity firms produce due diligence packages for potential acquisitions on demand. The finished PDF can be emailed via Gmail, saved to Google Drive, or posted to Slack channels. The Google Sheets integration can store raw financial data alongside the PDF for analysts who want to dig deeper. Visit the templates library for pre-built financial analysis workflows, check the pricing page, and explore the Integrations ecosystem. For more on data collection, see the web scraping glossary.
Sourcing from Authoritative Filings
The credibility of a financial-analysis report rests on where its numbers come from. Audited figures in a company's 10-K and 10-Q filings — submitted to the SEC and tagged in machine-readable XBRL — are the canonical source, whereas aggregator sites occasionally carry transcription errors or apply their own non-standard adjustments. A rigorous pipeline therefore anchors core line items (revenue, net income, total debt) to the original filings and uses aggregators only for convenience or for data the filings do not break out. Because audited statements follow recognized accounting standards such as US GAAP and IFRS (the latter overseen by the IFRS Foundation), grounding your ratios in them ensures comparisons across companies rest on a consistent definitional basis.
Edge Cases in Financial Statement Analysis
Cross-company financial comparison is riddled with subtleties that automated ratios can flatten. Fiscal years that end in different months make "trailing twelve months" the only fair basis for comparison; one-time items such as impairments, restructuring charges, and tax-law effects distort a single period's margins; and non-GAAP "adjusted" metrics that management favors are not comparable to GAAP figures without reconciliation. Restatements, changes in segment reporting, and differing treatments of leases or stock-based compensation further complicate peer benchmarking. Configuring the Data Processing step to normalize fiscal periods, separate recurring from non-recurring items, and footnote any definitional differences turns a superficially tidy report into one an analyst can actually trust.
Further Reading
Explore more about the tools and techniques used in this workflow: Web Scraping Best Practices, Ai Workflow Automation.