
The Report Download Problem: Death by a Thousand Dashboards
Every modern business runs on SaaS. Marketing uses Google Analytics, Mixpanel, or Amplitude for web analytics. Paid acquisition runs through Google Ads, Meta Ads, LinkedIn Ads, and maybe TikTok Ads. Sales lives in Salesforce or HubSpot. Project management happens in Jira, Monday.com, or Asana. Finance uses QuickBooks or Xero. HR tracks everything in BambooHR, Gusto, or Workday.
Each of these platforms has its own dashboard. Each dashboard has its own reports. And each report requires its own login, its own navigation path, its own filter settings, its own export button, and its own file format. When someone needs a consolidated view of performance across these platforms, someone has to log into each one, configure the report, download the file, and combine everything into a single spreadsheet or presentation.
The Monday Morning Report Grind
Here is what a typical Monday morning looks like for a marketing manager at a mid-size company:
- Log into Google Analytics. Navigate to the traffic acquisition report. Set the date range to last week. Export as CSV.
- Log into Google Ads. Navigate to the campaigns overview. Set the date range. Download the campaign performance report.
- Log into Meta Ads Manager. Wait for the dashboard to load. Navigate to the correct ad account. Export.
- Log into LinkedIn Campaign Manager. Pull the campaign metrics report. Export.
- Log into HubSpot. Pull the email campaign performance report. Export.
- Open Google Sheets. Import each CSV. Clean up the data. Build the weekly summary.
This process takes between 45 minutes and 2 hours. It is not analytical work — it is data collection. The actual analysis comes after the collection is done, and by then, a chunk of the morning is gone.
The Hidden Cost of Manual Report Gathering
A marketing manager spending 1.5 hours every Monday on report downloads loses 78 hours per year — nearly two full work weeks. For an agency account manager pulling reports for 8 clients across 5 platforms each, the annual time sink approaches 400 hours. That is a quarter of someone's working year consumed by logging in and clicking export.
Why This Problem Persists
- APIs are incomplete or absent. Many SaaS platforms offer APIs, but those APIs rarely cover every report available in the dashboard. Google Analytics has an API, but custom explorations are only available through the web interface. Smaller SaaS tools often have no API at all.
- APIs require developers. Using an API requires someone who can write code, handle OAuth flows, parse JSON responses, and maintain the integration when the API version changes. Most marketing, finance, and operations teams do not have dedicated developers.
- Each platform is different. There is no universal export standard. Each platform has its own date range selector, filter logic, export formats, and download method (direct download, email delivery, or async generation that requires waiting).
- The real report is in the UI, not the API. Many platforms show derived metrics, custom calculations, or visualizations in their dashboard that are not available through the API. To get exactly what you see in the dashboard, you need to interact with the dashboard.
Who Suffers Most
- Marketing agencies. An agency with 15 clients, each using 4 to 6 platforms, faces 60 to 90 individual report downloads every reporting period.
- Finance teams. Month-end close requires pulling financial reports from multiple systems — accounting, payroll, expense management, bank statements, revenue dashboards.
- Operations and leadership. Executive dashboards that combine data from multiple platforms require someone to collect data from each source first.
- Small businesses wearing many hats. When the same person handles marketing, finance, and operations, the report download burden multiplies.
The common thread is skilled professionals spending significant time on a task that requires no skill — logging in and clicking download.
How AI Browser Automation Downloads Reports from Any Dashboard
The reason SaaS report downloads have resisted automation is that every dashboard is different. A script written for Google Analytics will not work for Meta Ads. A macro recorded for Salesforce will break when Salesforce updates its interface. And API integrations do not cover dashboards that lack APIs.
AI browser automation takes a fundamentally different approach. An AI agent opens a real cloud browser, navigates to the dashboard, reads the page, and interacts with it the way a human would. It does not rely on recorded click coordinates or hardcoded CSS selectors. It reads labels, understands menu structures, and adapts when the interface changes.
The End-to-End Pipeline
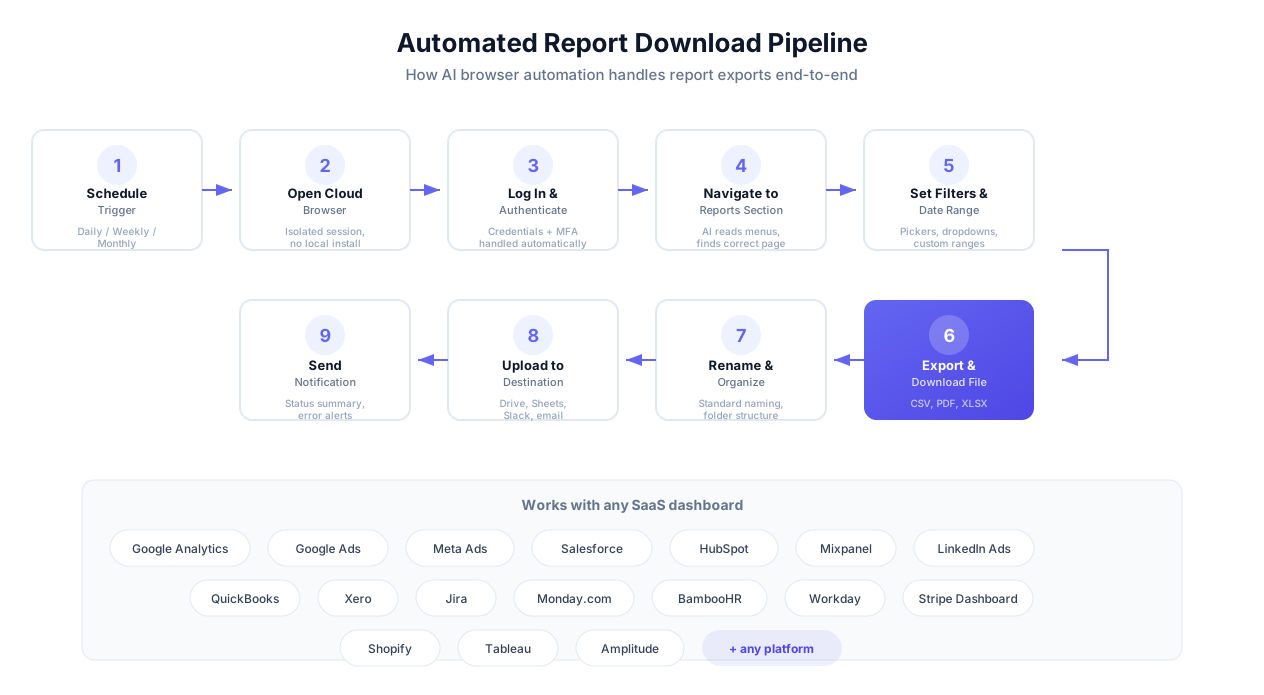
An automated report download follows a consistent pipeline, regardless of which SaaS platform is involved:
- Trigger on schedule. The automation runs on a schedule you define — every Monday at 7 AM, on the 1st of every month, every Friday afternoon.
- Open a cloud browser. The AI agent launches an isolated, ephemeral cloud browser session. Nothing runs on your local machine.
- Log in and authenticate. The agent enters stored credentials and handles multi-factor authentication — TOTP codes generated automatically, email codes retrieved from a monitored inbox, or a brief pause for SMS codes.
- Navigate to the correct report. The agent reads the dashboard's navigation menus, identifies the reports section, and navigates to the specific report you need — even if it is nested multiple levels deep.
- Configure filters and date ranges. The AI interacts with date pickers, dropdown menus, calendar widgets, and custom filter controls to set the correct parameters.
- Export and download the file. The agent clicks the export button, selects the file format (CSV, PDF, XLSX), waits for async generation if needed, and downloads the result.
- Rename and organize. Downloaded files get renamed from unhelpful defaults like
export.csvto your naming convention — for example,GoogleAds_CampaignPerformance_May_W3.csv— and placed in the correct folder. - Upload to destination. The report is delivered to Google Drive, SharePoint, Dropbox, a Slack channel, or a Google Sheet via built-in integrations.
- Send notification. A summary notification reports which downloads succeeded, which failed, and links to the files.
What Makes AI Different from Scripts
- No code to write. With Autonoly's AI agent chat, you describe the task in plain English. No selectors, no wait conditions, no error handlers.
- No code to maintain. When a dashboard updates its interface, the agent adapts because it understands the page semantically, not structurally. A button labeled "Download" is still a button labeled "Download" even if its CSS class changes.
- No per-platform development. Adding a new platform takes minutes of plain-English description, not days of scripting.
- Visual verification. Through live browser control, you can watch the AI navigate each dashboard in real time and intervene if needed.
When APIs Are the Better Choice
If a platform offers a well-documented, stable API that covers exactly the report you need, and you have developer resources to maintain the integration, using the API is a perfectly valid approach. APIs are faster, more reliable, and more efficient for high-frequency data pulls. AI browser automation is best for platforms without APIs, platforms with incomplete APIs, teams without developers, or situations where you need exactly what the dashboard shows — not what the API exposes.
Handling Difficult Dashboard Patterns
SaaS dashboards throw challenges that break simpler automation tools. The AI agent handles these gracefully:
- Asynchronous report generation. Some platforms show a "preparing export" screen before the file is ready. The AI waits for generation to complete rather than failing.
- Calendar date pickers. Date selection is wildly inconsistent across platforms — calendar popups, dropdowns, text fields, preset buttons. The AI handles each pattern.
- Multi-step exports. Select report type, choose columns, pick format, click export. The AI follows multi-step flows naturally.
- Lazy-loaded dashboards. Modern dashboards load data asynchronously. The AI waits for content to render before interacting.
- Session timeouts. When downloading from many platforms in sequence, the AI detects session timeouts and re-authenticates automatically.
Platform-by-Platform: What Report Downloads Actually Look Like
Each SaaS platform handles report exports differently. Here is what the AI agent encounters on the most common platforms and how it handles each one.
Analytics Platforms
Google Analytics. Standard reports are straightforward — navigate to the report, set the date range, click export. But custom explorations require navigating to a separate Explorations tab, opening a saved exploration, and exporting from there. The export button is a small icon that scripts often miss but AI reads visually. Many custom explorations have no API equivalent.
Mixpanel and Amplitude. Both require navigating through project selection, report type selection, and metric configuration before export. Their JavaScript-heavy interfaces with dynamic loading trip up script-based tools but work fine with an AI agent that waits for content to render.
Advertising Platforms
Google Ads. The dashboard is dense with multiple report access points — the Reports section, pre-built reports, and overview exports. The date range picker uses a custom calendar widget. Segments and column customization add complexity.
Meta Ads Manager. Notoriously slow to load and uses a complex JavaScript interface. Requires selecting the correct ad account (businesses often have multiple), then navigating to the right campaign level. Meta updates its UI several times per year, making script-based automation a maintenance nightmare. AI adapts to changes without breaking.
LinkedIn Campaign Manager. Has a unique export pattern — it emails the CSV file rather than offering a direct download. The AI can handle both the dashboard export trigger and the subsequent email retrieval.
CRM Platforms
Salesforce. Reports are powerful but complex — folders of saved reports, custom report types, a report builder. For large reports, Salesforce generates exports asynchronously and notifies when ready. The AI handles this wait-and-download pattern.
HubSpot. Reports are spread across marketing analytics, sales reports, and custom dashboards. The export process varies by section, and date range controls use a mix of presets and custom fields.
Financial Platforms
QuickBooks Online. Financial reports (P&L, balance sheet, cash flow) are under the Reports tab with individual date range and filter settings. The export button is often behind a dropdown menu.
Xero. Some reports lack a direct export option and require using the browser's print-to-PDF functionality — a pattern the AI handles by interacting with the print dialog.
Project Management and HR
Jira. Reporting is split between built-in reports and custom dashboards. Some reports can only be printed, not exported as data files — the AI uses print-to-PDF as a fallback.
Monday.com. Each dashboard widget has its own export option. Bulk exporting requires iterating through widgets, which the AI handles in sequence.
Workday. Uses a search-based navigation system rather than traditional menus. The AI agent's ability to use search bars makes it well-suited for Workday's interface pattern.
BambooHR. Reports under a dedicated section with pre-built and custom reports. Export requires running the report, waiting for results, and clicking download.
Platform-Agnostic by Design
You do not need to learn each platform's export flow. Describe what you need — "download last month's campaign performance report from Google Ads as a CSV" — and the AI handles the platform-specific navigation, filter configuration, and export mechanics. When a platform changes its interface, the AI adapts. When you add a new platform, setup takes minutes.
Use Cases: Who Automates Report Downloads and Why
Automated report downloads serve different purposes for different roles. Understanding your specific use case helps prioritize which platforms to automate first.
Marketing Agencies: Client Reporting at Scale
A typical agency manages 10 to 30 clients, each with campaigns across 3 to 6 platforms. That is 30 to 180 individual report downloads per reporting period. Without automation, the download step alone takes 30 to 60 minutes per client — 7 to 15 hours per reporting cycle for 15 clients.
With automation, report day transforms. All downloads happen overnight. CSVs arrive organized by client and platform in Google Drive, and recurring jobs like Google Ads reporting to Sheets run untouched. The account manager opens a pre-populated reporting template and spends their time on analysis and client communication instead of data collection.
| Agency Task | Manual Time | Automated Time | Savings |
|---|---|---|---|
| Download reports for 1 client (5 platforms) | 45 min | 0 min (runs overnight) | 45 min |
| Download reports for 15 clients (75 reports) | 10-15 hours | 5 min review | ~14 hours |
| Monthly client reporting cycle | 2-3 days | Half a day (analysis only) | 1.5-2.5 days |
Finance Teams: Month-End Close
Month-end close requires pulling reports from multiple systems within a tight 3 to 5 day window: P&L from the accounting platform, revenue from the billing system, expenses from the expense tool, payroll summaries, bank statements, and CRM pipeline data. Automating the download step means all reports are ready on the first business day of the new period, letting the finance team focus on reconciliation rather than data collection.
Operations Teams: Cross-Platform Dashboards
Weekly operations reports typically pull metrics from the project management tool, customer support platform, product analytics, and infrastructure monitoring. Without automation, someone spends 1 to 2 hours per week downloading and entering data points — 50 to 100 hours per year. Automation reduces this to a few minutes of reviewing the pre-populated dashboard.
E-Commerce and Compliance
E-commerce managers need sales, inventory, and fulfillment reports from Shopify, Amazon Seller Central, eBay, and Etsy — all with different portals and export flows. Compliance teams need regular exports for audit trails: access logs, transaction records, employee activity reports. In both cases, automation ensures every required report is downloaded on schedule, every time, with no platforms forgotten.
Start with Your Highest-Frequency Downloads
Prioritize by frequency and time cost. A weekly report from 5 platforms that takes an hour to collect costs 52 hours per year. A monthly report from 3 platforms that takes 30 minutes costs only 6 hours per year. Automate the weekly downloads first — the ROI is immediate.
Four Approaches Compared: Manual, APIs, RPA, and AI Browser Automation
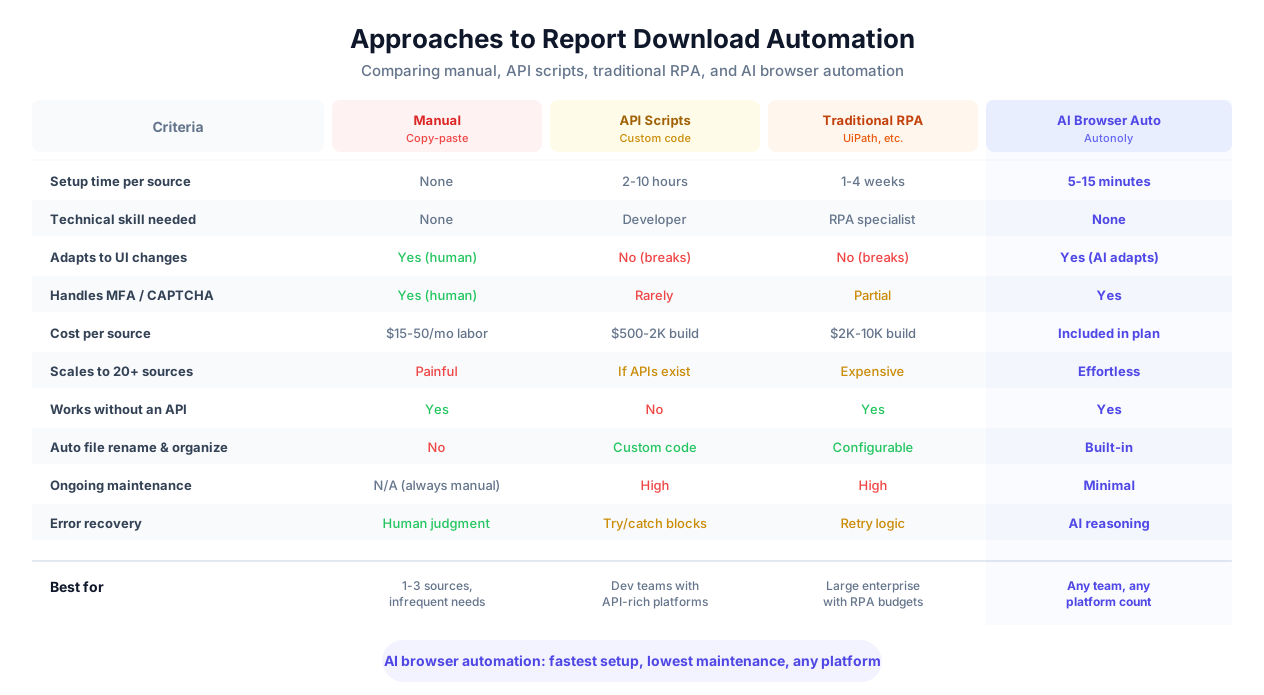
Not every team needs AI browser automation, and not every platform is best served by the same approach. Here is an honest comparison of the four main options.
1. Manual Downloads
When it works: Fewer than 5 platforms, infrequent downloads (monthly or less), no time pressure. If you spend less than 30 minutes per month on report downloads, automation setup may not be worth it.
When it breaks down: More than 5 platforms, weekly or daily downloads, tight deadlines, multiple clients. Manual downloads are single-threaded and dependent on one person's availability.
2. API Scripts
When it works: The platform has a stable API covering the exact report you need, and you have a developer to build and maintain the integration. Pulling transaction data from Stripe's API or ad spend from the Google Ads API are good examples.
When it breaks down: The API does not cover custom reports or dashboard-specific views. The API changes frequently (Meta's Marketing API is notorious). You do not have a developer. You need the exact dashboard output format (PDF with charts, formatted Excel).
Honest assessment: If the data is available through a stable API and you have developer resources, APIs are the most efficient approach. The question is whether the API covers what you actually need — for many SaaS platforms, it does not.
3. Traditional RPA
When it works: Large enterprises with dedicated IT budgets, existing RPA infrastructure, and stable target applications.
When it breaks down: UI changes. RPA bots rely on element selectors, and when dashboards update, bots break. RPA teams often spend more time maintaining existing bots than building new ones. Licensing costs start at $5,000 to $15,000 per bot per year, plus $10,000 to $50,000 per workflow implementation.
4. AI Browser Automation
When it works: Any platform, any report, any team. Strongest for platforms without APIs, complex or frequently changing UIs, teams without developers, and scenarios requiring exact dashboard output. Setup takes minutes per platform.
When it breaks down: Very high-frequency pulls (thousands per minute) are better served by APIs. Platforms with excellent, comprehensive APIs and a dedicated developer may find API-based approaches more efficient.
The Practical Decision Framework
If the platform has a stable API that covers exactly what you need and you have a developer, use the API. For everything else — platforms without APIs, incomplete APIs, teams without developers, or when you need the exact dashboard output — use AI browser automation. Most teams end up with a hybrid: APIs for 2 to 3 platforms, AI browser automation for the rest.
Time-to-Value Comparison
| Approach | Setup Time | First Result | Ongoing Maintenance |
|---|---|---|---|
| API Script | 2-10 hours per platform | Days | 2-4 hours/month |
| Traditional RPA | 1-4 weeks per workflow | Weeks to months | 4-8 hours/month |
| AI Browser Automation | 5-15 minutes per platform | Minutes | Near zero (AI self-heals) |
Time Savings and ROI: The Numbers Behind Report Automation
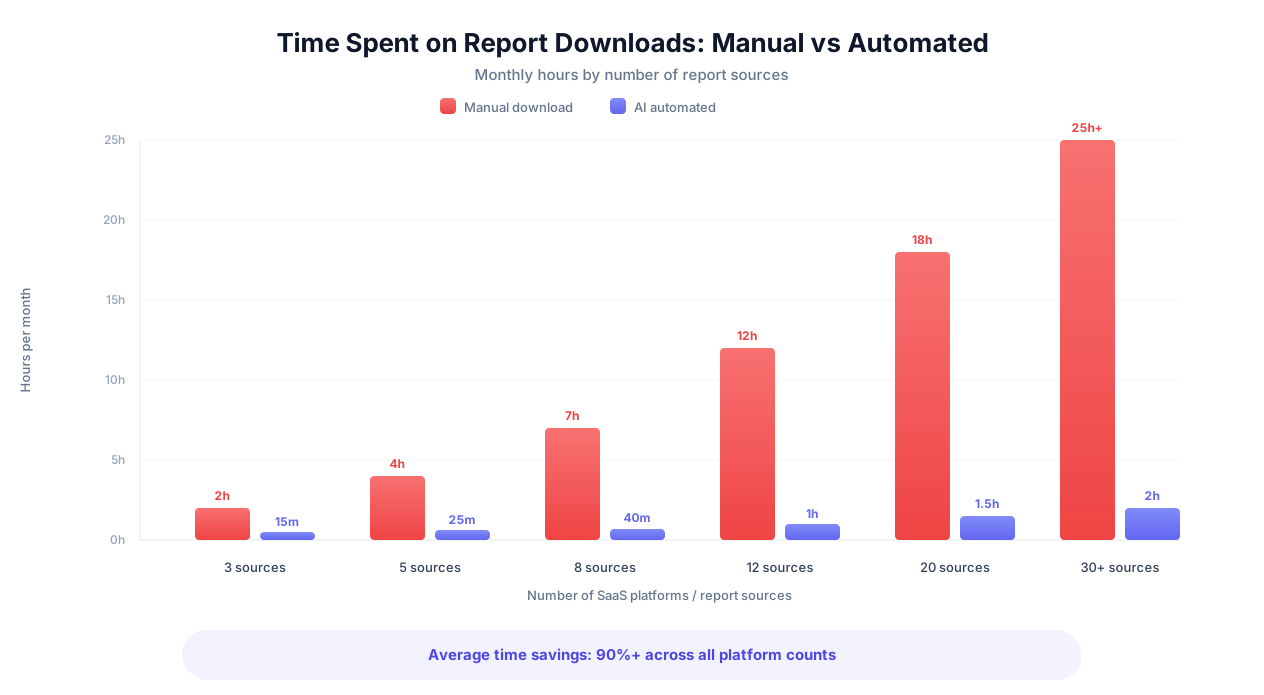
The ROI of automating report downloads is straightforward to calculate: how many platforms, how often, and how long each download takes manually.
Manual Time Benchmarks
| Platform Type | Manual Time per Report | Why It Takes That Long |
|---|---|---|
| Analytics (GA, Mixpanel) | 10-20 min | Complex navigation, multiple filter steps, slow loading |
| Ad platforms (Google, Meta) | 15-25 min | Dense UI, date range configuration, format selection |
| CRM (Salesforce, HubSpot) | 10-30 min | Report builder, async generation, large datasets |
| Financial (QuickBooks, Xero) | 10-15 min | Multiple report types, comparison periods |
| PM tools (Jira, Monday.com) | 5-15 min | Board/sprint selection, widget-level exports |
| HR (BambooHR, Workday) | 10-20 min | Complex navigation, slow report generation |
The average across all platform types is approximately 15 minutes per report download, including login, navigation, filter configuration, export, and file organization.
Annual Time Savings by Scenario
| Scenario | Platforms | Frequency | Manual Hours/Year | Hours Saved/Year |
|---|---|---|---|---|
| Small marketing team | 5 | Weekly | 65 hours | 60 hours |
| Agency (10 clients) | 40 | Monthly | 120 hours | 115 hours |
| Finance team | 8 | Monthly | 24 hours | 22 hours |
| Operations lead | 12 | Weekly | 156 hours | 148 hours |
| E-commerce (multi-channel) | 6 | Weekly | 78 hours | 72 hours |
Beyond Time: The Quality ROI
- Consistency. Every report downloads with the same date range, filters, and format. No accidental date range mistakes or forgotten filters.
- Timeliness. Reports are ready when you need them — Monday morning reports downloaded overnight Sunday, month-end reports ready on the first business day.
- Reliability. Automation does not forget platforms, skip clients, or miss newly added SaaS tools.
- Coverage during absences. Downloads continue without interruption when the responsible person is on vacation, sick, or leaves the company.
The Compounding Effect
An operations lead saving 3 hours per week saves 156 hours per year. Over three years, that is 468 hours — nearly 12 full work weeks. At a fully loaded cost of $50 to $75 per hour, that is $23,400 to $35,100 in labor savings from a single automation category. And the savings grow every time a new platform is added.
Step-by-Step: Setting Up Your First Automated Report Download
The fastest way to understand automated report downloads is to set one up. This walkthrough uses Autonoly, but the general approach applies to any AI browser automation tool.
Step 1: Choose Your First Platform
Start with the platform you download reports from most frequently. Good first candidates: Google Analytics (familiar navigation) or Google Ads (high download frequency, clear export flow). Save Salesforce or Workday for after you are comfortable with the process.
Step 2: Document What You Do Manually
Write down the exact steps you take. This serves as your automation brief:
- Go to ads.google.com
- Log in with [email protected]
- Click the "Reports" tab in the left navigation
- Open the saved report called "Weekly Campaign Performance"
- Set the date range to "Last 7 days"
- Click the download icon, select "CSV"
- Rename the file to GoogleAds_WeeklyCampaigns_[date].csv
- Upload to Google Drive > Marketing > Weekly Reports
No CSS selectors or technical details needed — plain language is sufficient.
Step 3: Store Credentials and Run the First Download
Add the platform's credentials to Autonoly's encrypted vault. Then open the AI agent chat and describe the task conversationally:
"Log into Google Ads using the marketing credentials I stored. Go to the Reports tab and open the saved report called Weekly Campaign Performance. Set the date range to last 7 days. Download it as CSV. Rename the file to GoogleAds_WeeklyCampaigns with today's date. Save to my Google Drive in Marketing/Weekly Reports."
Watch the AI execute through live browser control. If it takes a wrong turn, correct it in real time.
Step 4: Verify, Save, and Schedule
Confirm the downloaded file has the correct data, name, and location. Then save the task as a reusable workflow using the visual workflow builder and set a recurring schedule — every Monday at 6 AM, for example. (For a deeper look at recurrence options, see our guide to scheduling automated workflows.)
Step 5: Expand to All Platforms
Repeat for each platform. After the first 2 to 3, setup becomes faster:
- Day 1: First platform (15-20 minutes including verification)
- Day 2-3: 3 to 5 more platforms (10-15 minutes each)
- Week 2: Remaining platforms, scheduling configured
- Week 3: First full automated cycle runs; review and adjust
Step 6: Build the Consolidated Report
With automated downloads landing in a consistent folder structure, build your consolidated reporting system:
- Google Sheets with IMPORTDATA: Sheet tabs auto-update when CSVs refresh in Drive
- Data warehouse: Feed CSVs into BigQuery or Snowflake for cross-platform analysis
- Dashboard tools: Connect Looker, Tableau, or Metabase to the download folder
- Simple folder review: Well-organized, dated reports are often sufficient
Tip: Group by Reporting Cadence
Organize workflows by cadence rather than platform. Create a "Weekly Reports" group that runs every Monday, a "Monthly Reports" group for the 2nd of each month, and a "Quarterly Reports" group for quarter-end. This keeps scheduling simple and ensures all reports for a given period download together.
Advanced Patterns and Getting Started
Once basic report downloads are running reliably, several advanced patterns multiply the value.
Multi-Account Downloads
Agencies managing multiple client accounts within a single platform (like Google Ads or Meta Ads) can loop through all accounts in one session: switch to client A's account, download, switch to client B, download — all within the same authentication. This is faster and more efficient than logging in separately for each account.
Conditional Downloads
Not every report needs to be downloaded every time. The AI can check a condition first: "If the overall CPA for last week is above $50, download the campaign performance report. Otherwise, skip and send me a message saying CPA is within range."
Data Transformation on Download
Raw exports often need cleanup before they are useful. The automation can filter unnecessary columns, standardize date formats across platforms, convert currencies, or merge multiple reports from the same platform into a single file before saving.
Chained Downloads Across Platforms
Some workflows require data from one platform to inform the download from another — download revenue from Stripe, then use that number as a filter in a Google Analytics report. The AI can execute this as a single chained workflow.
Automated Report Compilation
The most powerful extension: instead of just downloading files, the automation opens a Google Sheets template or slide deck, inserts the downloaded data, applies formatting, generates a summary section with key metrics, and sends the compiled report to the distribution list — the same pattern covered in our guide to automating email reports. The human role shifts from data gathering to review and insight generation.
Error Recovery
Robust automation includes automatic retry (after 5, 15, then 30 minute delays), partial completion (delivering 9 successful downloads and alerting about 1 failure rather than treating the whole batch as failed), and fallback strategies when a platform is temporarily unavailable.
Avoid Over-Engineering from the Start
Start with simple, scheduled downloads. Get each platform running reliably before layering on conditional logic, data transformations, or multi-platform chains. Most of the value (90% or more of time savings) comes from the basic download automation.
Your Roadmap: From Manual to Automated
Phase 1 (30 minutes): Audit your current downloads. List every platform, report name, frequency, time per download, and destination.
Phase 2 (1 hour): Automate your top 3 platforms. Budget 15 to 20 minutes per platform for the first run including verification.
Phase 3 (1-2 weeks): Expand to all platforms. Each new one takes 5 to 15 minutes at this point.
Phase 4 (ongoing): Optimize with advanced patterns — consolidated sheets, conditional downloads, multi-account loops.
What Success Looks Like
When automation is working well, your Monday mornings change. Instead of spending 1 to 2 hours logging into dashboards, you open a folder that already contains every report — downloaded overnight, named consistently, organized by platform and date range. Your reporting template is pre-populated. You start analyzing instead of collecting.
The automation runs whether you are in the office, on vacation, or asleep. It does not forget platforms, skip clients, or make date-range mistakes. Over time, you forget that report downloads were ever a manual task — which is exactly how it should be.
The 15-Minute Challenge
Pick one SaaS dashboard you download reports from every week. Set up the automated download right now — it takes about 15 minutes. Run it once, verify the result, and schedule it. Next week, when that report is waiting in your folder at 7 AM without you lifting a finger, you will understand why teams that automate their report downloads never go back to manual.