

Why Automate Nifty 50 Stock Analysis?
The Nifty 50 index represents India's 50 largest and most liquid stocks, serving as the primary benchmark for the Indian equity market. Investors, fund managers, and analysts who track the Nifty need regular analysis of constituent performance, sector rotation, valuation metrics, and technical indicators. Producing this analysis manually — visiting financial websites, copying data, running calculations, and formatting reports — consumes hours that could be spent on actual investment decision-making.
Automating the analysis pipeline means fresh reports are generated on your schedule with zero manual effort. The data is always current, the calculations are always consistent, and the reports are always formatted professionally. This is particularly valuable for advisors who need to produce regular market updates for clients.
A PDF report format is particularly valuable for financial analysis because it creates a permanent, shareable snapshot. Unlike live dashboards that change with every refresh, a PDF captures the market state at a specific point in time — ideal for board presentations, client updates, weekly investment committee reviews, and compliance documentation.
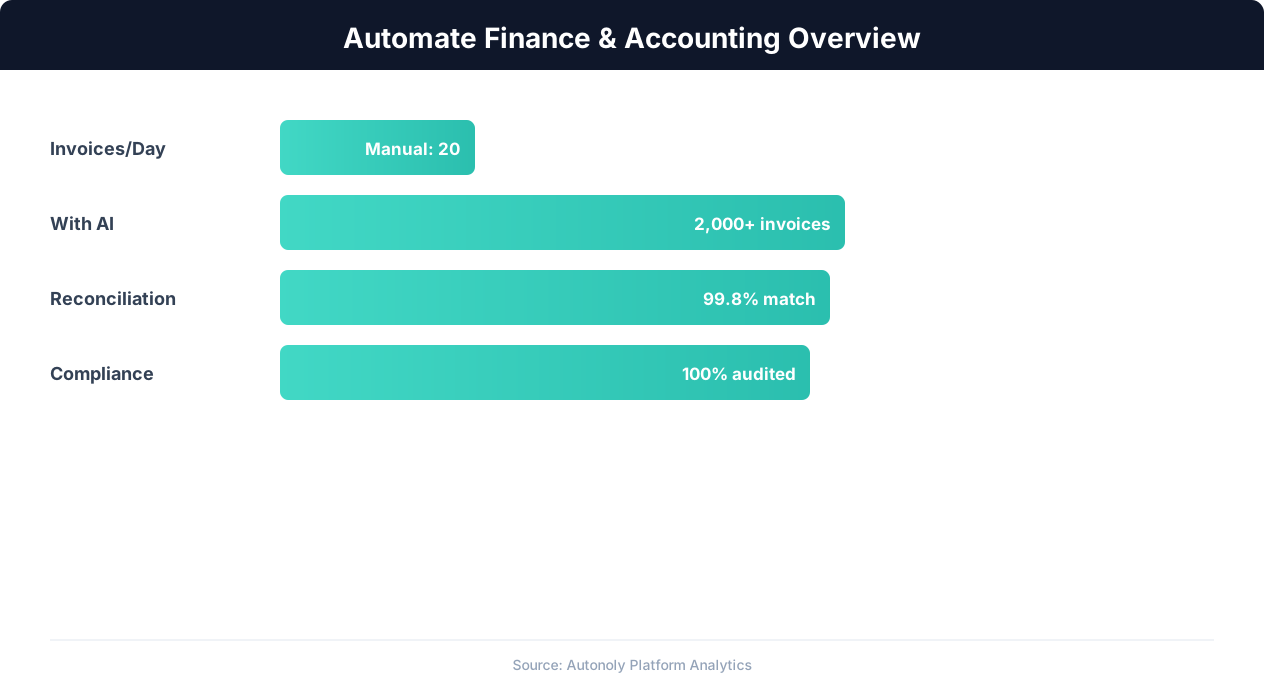
Finance automation ROI across different accounting tasks
Key Insight: Finance teams that automate routine tasks reduce month-end close time by 30% and cut error rates by 59% (Ernst & Young Financial Automation Report).
How Autonoly Builds the Analysis Pipeline
The AI Agent Chat lets you describe the analysis you want. You might say "analyze the Nifty 50 — show me top gainers and losers, sector performance, stocks trading below their 200-day moving average, and generate a PDF report." The agent builds the complete pipeline from data collection to report delivery.
Data Collection with Browser Automation
Using Browser Automation, the agent navigates Indian financial websites — NSE India, Moneycontrol, Screener.in, or any other source you prefer. The full Playwright browser handles JavaScript-rendered charts, dynamic data tables, and authentication where required. The Data Extraction engine pulls structured data for each of the 50 constituents — current price, day change, volume, market cap, P/E ratio, dividend yield, 52-week high/low, and sector classification.
This multi-source approach lets you cross-reference data for accuracy. If NSE shows one price and Moneycontrol shows another, the agent can flag discrepancies.
Python-Powered Analysis
The scraped data flows into a Python analysis script executed via the SSH & Terminal feature. The agent writes and runs Python code using pandas for data manipulation, NumPy for calculations, and technical analysis libraries for indicator computation.
Standard analysis modules include sector performance breakdown showing which sectors are outperforming and underperforming, top gainers and losers by daily and weekly percentage change, valuation metrics ranking stocks by P/E, P/B, and dividend yield, technical indicators including RSI, MACD, Bollinger Bands, and moving average crossovers, and volume analysis identifying unusual trading activity.
The Data Processing feature ensures all calculations are correct and results are formatted consistently. You can customize which analyses are included and add your own Python code for proprietary indicators.
Professional PDF Reports
The report generation uses matplotlib and seaborn for publication-quality charts — sector heatmaps, performance bar charts, technical indicator overlays, and scatter plots. Tables are formatted with clear headers, alternating row colors, and conditional highlighting (green for gains, red for losses).
The final PDF includes an executive summary, detailed sector analysis, individual stock highlights, technical analysis section, and risk indicators. It is formatted for professional distribution to clients, investment committees, or team members.
Customization and Extensibility
The Visual Workflow Builder lets you modify the pipeline visually. Add new data sources, change analysis parameters, swap chart types, or modify the report template. The Logic & Flow feature enables conditional analysis — for example, including a special section when market volatility exceeds a threshold or when a specific stock breaks through a key level.
Who Uses This Automation
Retail investors use automated Nifty reports to make informed decisions without spending hours on research. Financial advisors generate client-ready reports showing portfolio-relevant stock performance. Quantitative analysts use the extracted data as input for systematic trading strategies. Research teams at brokerages use it to supplement proprietary data with a cross-check from the public NSE website.
Compliance and Disclaimer Considerations
Automated stock analysis is a research aid, not investment advice, and the distinction matters legally. In India, securities markets are overseen by the Securities and Exchange Board of India (SEBI), and anyone distributing buy/sell recommendations professionally may fall under its research-analyst or investment-adviser regulations. If your PDF reports are shared beyond personal use, it is prudent to include a clear disclaimer stating that the analysis is informational, derived from public data that may be delayed, and not a solicitation to trade — the same investor-protection principle promoted by educational resources like the U.S. SEC's Investor.gov. Sourcing data from official exchange feeds rather than redistributing a third party's proprietary dataset also keeps your reports on firm footing, since most data vendors restrict redistribution in their terms.
Handling Market Data Edge Cases
Equity datasets are full of edge cases that can silently corrupt analysis. Corporate actions — splits, bonuses, rights issues, and dividends — change raw prices in ways that look like dramatic moves but are mechanical, so your Python pipeline should work from adjusted prices when computing returns or moving averages. Trading holidays, circuit breakers that halt a stock mid-session, newly listed or delisted constituents, and suspended scrips all require defensive handling so a single bad row does not skew sector averages. Building validation checks into the Data Processing step — flagging null prices, impossible percentage changes, or stale timestamps — ensures the polished PDF reflects reality rather than a scraping glitch.
Scheduling and Distribution
Weekly reports are common for portfolio reviews, while daily reports suit active traders. The report can be emailed via Gmail, saved to Google Drive, or posted to Slack for team access. You can also save the raw data to Google Sheets alongside the PDF report, building a historical price database for long-term trend analysis. Visit the templates library for pre-built stock analysis workflows, check the pricing page, and explore the Integrations ecosystem. For more on data collection, see our guide on web scraping.
Further Reading
Explore more about the tools and techniques used in this workflow: Web Scraping Best Practices, Ai Workflow Automation.