

Why Scrape Stock Market Data to Excel?
Professional-grade financial data feeds are expensive. Bloomberg Terminal, Refinitiv, and similar platforms cost thousands per month. For individual investors, small fund managers, students, and researchers, this pricing is prohibitive. Meanwhile, the same data is available on free financial websites — just not in a convenient, downloadable format. Web scraping bridges this gap, making financial data accessible to everyone.
Excel remains the dominant tool for financial analysis. Analysts build models in Excel, portfolio managers track positions in Excel, and research reports are generated from Excel data. Having stock market data flow directly into organized spreadsheets eliminates the most tedious part of financial analysis — data collection and formatting.
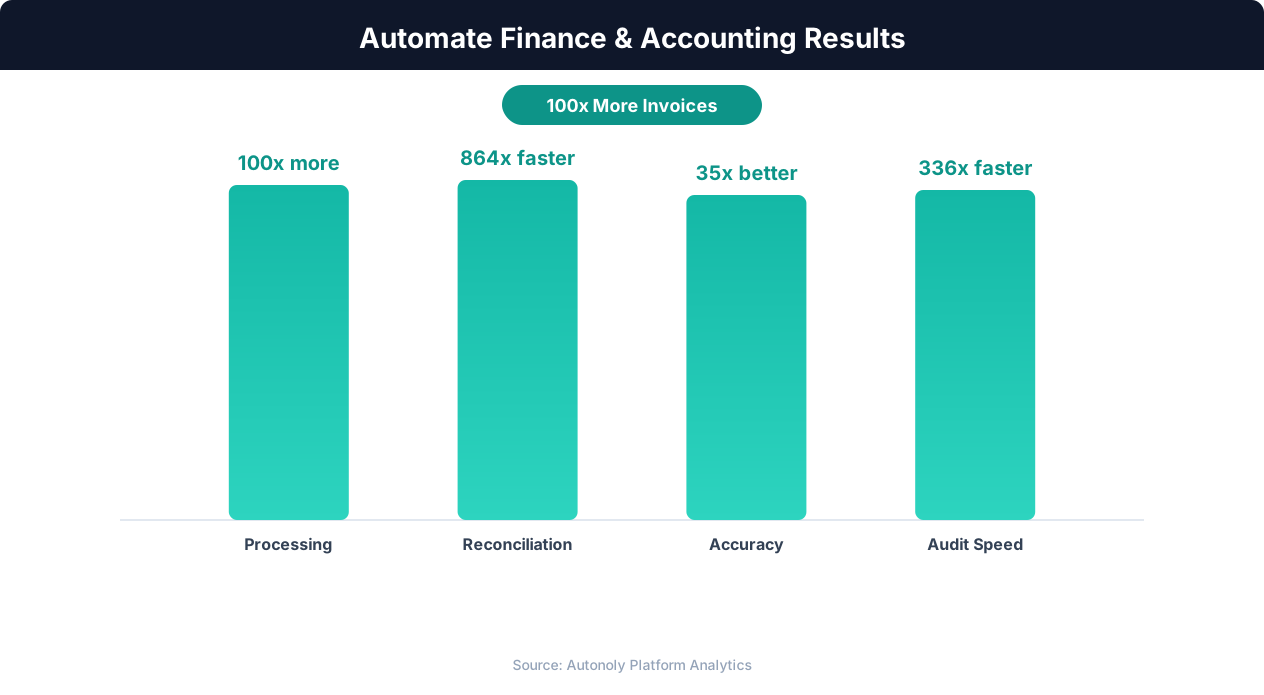
Time savings from automating financial reporting workflows
Key Insight: Automated expense tracking catches 27% more policy violations than manual review, saving organizations an average of $52 per report (SAP Concur Research).
How Autonoly Collects Stock Market Data
The AI Agent Chat lets you describe your data needs naturally. You might say "scrape price, volume, P/E, and market cap for all S&P 500 stocks from Yahoo Finance and save to Excel." The agent builds the complete data collection pipeline.
Multi-Source Data Collection
Using Browser Automation, the agent navigates financial websites with a full Playwright browser. This is essential because financial data sites use heavy JavaScript rendering, dynamic charts, and interactive tables that simple HTTP scrapers cannot access. The Data Extraction engine handles the variety of table formats, chart tooltips, and data widgets found across different financial platforms.
You can configure the agent to collect data from multiple sources for the same stocks, enabling cross-validation. If Yahoo Finance shows one market cap figure and MarketWatch shows another, the discrepancy is flagged in the output.
Data Points Available
The scraping covers any data visible on financial websites — current price, opening price, day high/low, volume, market cap, P/E ratio, P/B ratio, EPS, dividend yield, 52-week range, beta, analyst ratings, price targets, earnings dates, sector classification, and historical price data. The exact fields depend on what the source website displays.
The Data Processing feature can calculate additional derived metrics — price-to-sales ratio, enterprise value, relative strength versus the index, custom valuation multiples, and technical indicators computed from price history.
Excel Organization
The output Excel file is structured for immediate use. A summary sheet provides an overview of all stocks with key metrics. Detailed sheets break data down by sector, market cap tier, or custom groupings. A metadata sheet documents the data sources, extraction timestamp, and any data quality notes.
The Visual Workflow Builder lets you customize the output format — choose which columns to include, how sheets are organized, and what formatting to apply. The Logic & Flow feature adds conditional formatting in the output — highlighting stocks that meet specific screening criteria.
Screening and Filtering
Beyond raw data collection, the pipeline can function as a stock screener. Filter the output to show only stocks with P/E below 15, dividend yield above 3%, and positive earnings growth. Or screen for momentum — stocks hitting 52-week highs with above-average volume. These screens run automatically on each data collection cycle, keeping your investment watchlist current.
Multi-Market Coverage
Financial markets are global, and the agent can scrape data from any market's public website. US equities from Yahoo Finance or NASDAQ.com, Indian stocks from NSE India or Moneycontrol, European equities from London Stock Exchange or Euronext, and Asian markets from respective exchange websites. The Visual Workflow Builder lets you create workflows that span multiple markets, producing a unified global watchlist in one Excel file.
Historical Data and Trend Analysis
Configure the agent to collect historical price data alongside current metrics. This enables trend analysis, moving average calculations, and performance comparison over custom time periods. Historical data accumulates over multiple runs, building a comprehensive financial database in Excel. Over months, your file accumulates enough data points for meaningful backtesting and time-series modeling.
Alert Integration
Combine data extraction with Logic & Flow controls for smart alerts. Set up rules like: notify via Slack when a watchlist stock drops below its 200-day moving average, or when a stock's P/E ratio falls below a threshold you define.
Scheduling and Freshness
Stock data changes every trading day. Daily scheduled runs ensure your Excel file always reflects the latest market data. Weekly runs work for longer-term investors who do not need daily granularity. The SSH & Terminal feature can run custom Python analysis on the collected data before Excel generation. The Google Sheets integration provides a collaborative alternative. Visit the templates library for pre-built stock data workflows, check the pricing page, and explore the Integrations ecosystem. For more background, see the web scraping glossary.
Data Licensing and Redistribution
Market data carries usage terms that are easy to overlook when scraping is this convenient. Most consumer finance sites license their quotes from exchanges and explicitly restrict redistribution in their terms of service, so a scraped Excel file is fine for personal or internal analysis but problematic to resell or republish. Exchanges and regulators are the canonical sources: in the U.S., the SEC governs market structure and the Investor.gov education site explains how retail investors should interpret data responsibly. For anything customer-facing or commercial, a licensed market-data API is the appropriate route. Treating your scraped dataset as decision-support rather than a redistributable product keeps the workflow firmly within bounds.
Data Quality Edge Cases
Reliable screening depends on clean inputs, and financial pages are riddled with traps. Free quotes are typically delayed 15–20 minutes, after-hours and pre-market sessions report thin and volatile prices, and tickers occasionally clash across exchanges (the same symbol meaning different companies in different markets). Currency mismatches when combining global watchlists, stock splits that distort historical comparisons, and "N/A" cells for metrics a company does not report can all silently break calculations. Building validation into the Data Processing step — checking timestamps for staleness, normalizing currencies, adjusting for corporate actions, and flagging missing fields — turns a raw scrape into a dataset you can actually screen and model against with confidence.
Further Reading
Explore more about the tools and techniques used in this workflow: Best Web Scraping Tools, Web Scraping Best Practices, Scheduled Execution.