

Why Track Forex Rates Systematically?
Foreign exchange rates affect every business that operates internationally. Import costs, export revenues, overseas payroll, and international investments all fluctuate with currency movements. Yet many businesses track forex rates ad hoc — checking rates manually when a payment is due rather than maintaining a systematic record that enables analysis and planning.
Automated rate tracking solves this by building a comprehensive currency database. With historical rate data in Excel, treasury teams can identify optimal timing for large transfers, finance teams can calculate accurate cost basis for international transactions, and analysts can forecast currency impact on revenue and expenses.
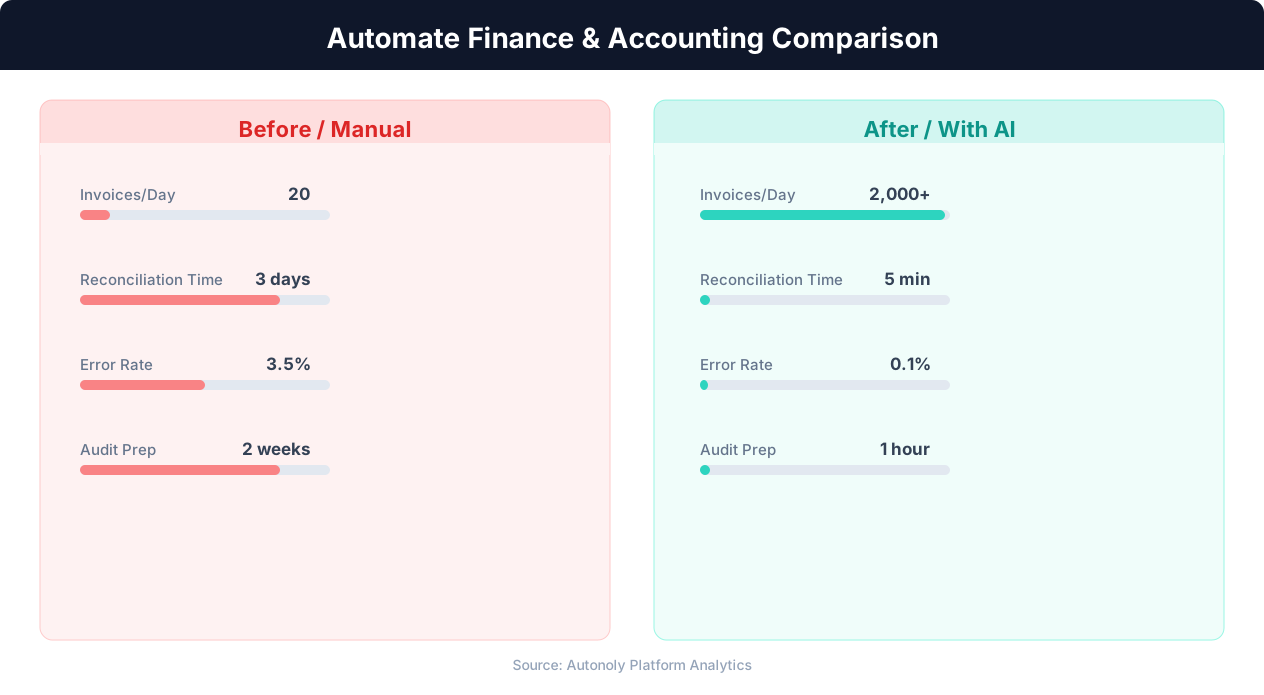
Error reduction in automated vs manual financial processes
Key Insight: Finance teams that automate routine tasks reduce month-end close time by 30% and cut error rates by 59% (Ernst & Young Financial Automation Report).
How Autonoly Tracks Forex Rates
The AI Agent Chat lets you set up tracking conversationally. Specify your currency pairs — EUR/USD, GBP/JPY, USD/INR, or any combination — and the agent builds the complete tracking pipeline.
Data Collection from Multiple Sources
Using Browser Automation, the agent navigates forex data websites — XE.com, Investing.com, OANDA, or central bank websites. The full Playwright browser handles the interactive charts, dynamic rate tickers, and JavaScript-rendered data tables these sites use. The Data Extraction engine captures the bid/ask rates, mid-market rate, daily high and low, opening rate, and percentage change.
For maximum accuracy, the agent can cross-reference rates from multiple sources, flagging any significant discrepancies. Central bank reference rates provide official benchmarks for accounting purposes — for example, the European Central Bank publishes daily euro reference rates that auditors widely accept — while market rates from forex platforms show actual trading levels.
Historical Rate Database
Each scheduled run appends new rate data to your Excel file, building a time-series database over time. After a few months of daily tracking, you have a comprehensive rate history that supports trend analysis — moving averages reveal medium-term trends, volatility calculations inform hedging decisions, and seasonal patterns help predict future movements.
The Data Processing feature calculates derived metrics — daily returns, rolling volatility, moving averages (20-day, 50-day, 200-day), and relative strength between currency pairs. These calculations run automatically as part of the pipeline, so your Excel file always contains both raw rates and analytical metrics.
Excel Organization for Financial Teams
The output Excel file is organized for financial use. A current rates sheet shows the latest rates for all tracked pairs. A historical data sheet contains the full time series with one row per date per pair. A summary sheet shows daily, weekly, and monthly change statistics. And a calculations sheet provides derived metrics like volatility and moving averages.
The Visual Workflow Builder lets you customize the output to match your organization's reporting requirements. The Logic & Flow feature can add conditional alerts — when a currency pair moves beyond a defined range, the workflow triggers a Slack or email notification alongside the Excel update.
Use Cases Across the Organization
Treasury teams use the data to time large currency conversions, buying when rates are favorable rather than at arbitrary payment dates. Finance teams use historical rates for accurate revenue and cost calculations in multi-currency reporting. Risk management uses volatility data to set hedging parameters. And investors use rate trend data for carry trade analysis and emerging market currency positioning.
International e-commerce companies track rates for dynamic pricing adjustments across storefronts in different countries. Travel companies monitor corridor rates for package pricing. Remittance services track exchange rates for competitive analysis across different corridors. Freelancers and contractors use rate data to determine optimal invoicing currencies.
Alert and Reporting Integration
Logic & Flow controls enable smart forex alerts. Set thresholds for specific pairs — get a Slack notification when USD/INR crosses 85.00 or when EUR/USD volatility exceeds a historical average. These alerts help treasury teams time their currency purchases and hedging decisions effectively.
Scheduling for Consistent Data
Daily rate tracking at a consistent time (such as market close) provides the most useful dataset for financial analysis. The agent handles timezone differences automatically — scraping rates at the appropriate time for each currency's primary market. The Visual Workflow Builder can save data simultaneously to Excel for offline analysis and Google Sheets for real-time team access. Visit the templates library for pre-built forex tracking workflows, check the pricing page, and explore the Integrations ecosystem. The SSH & Terminal feature enables custom Python analysis on rate data. For more background, see the web scraping glossary.
Accounting Standards and Compliance
When forex data feeds financial statements rather than just trading decisions, the choice of rate becomes an audit matter. Accounting frameworks such as IFRS — maintained by the IFRS Foundation — and US GAAP specify which exchange rate applies when translating foreign-currency transactions and balances, typically distinguishing the spot rate at transaction date, the closing rate at period end, and average rates for income statements. Capturing the rate source, the exact timestamp, and the rate type in your spreadsheet creates the audit trail finance teams need to defend their translations. Because central-bank reference rates are published once daily while market rates move continuously, documenting which one you used for which purpose prevents the kind of inconsistency that triggers audit findings.
Handling Forex Edge Cases
Currency data introduces subtle edge cases worth handling explicitly. Quoting conventions differ — some pairs are quoted as units of foreign currency per dollar and others the inverse — so a normalization step prevents inverted rates from corrupting calculations. Weekend and holiday gaps mean the spot market is closed even though websites still display a last-known rate, which can masquerade as stale data; pegged or managed currencies barely move and can signal a scraping error when they "flatline"; and bid/ask spreads widen dramatically during low-liquidity sessions. Configuring the Logic & Flow layer to recognize market hours and validate rate plausibility keeps your time series clean and your volatility metrics meaningful.
Further Reading
Explore more about the tools and techniques used in this workflow: Web Scraping Best Practices, Schedule Automated Workflows, Scheduled Execution.